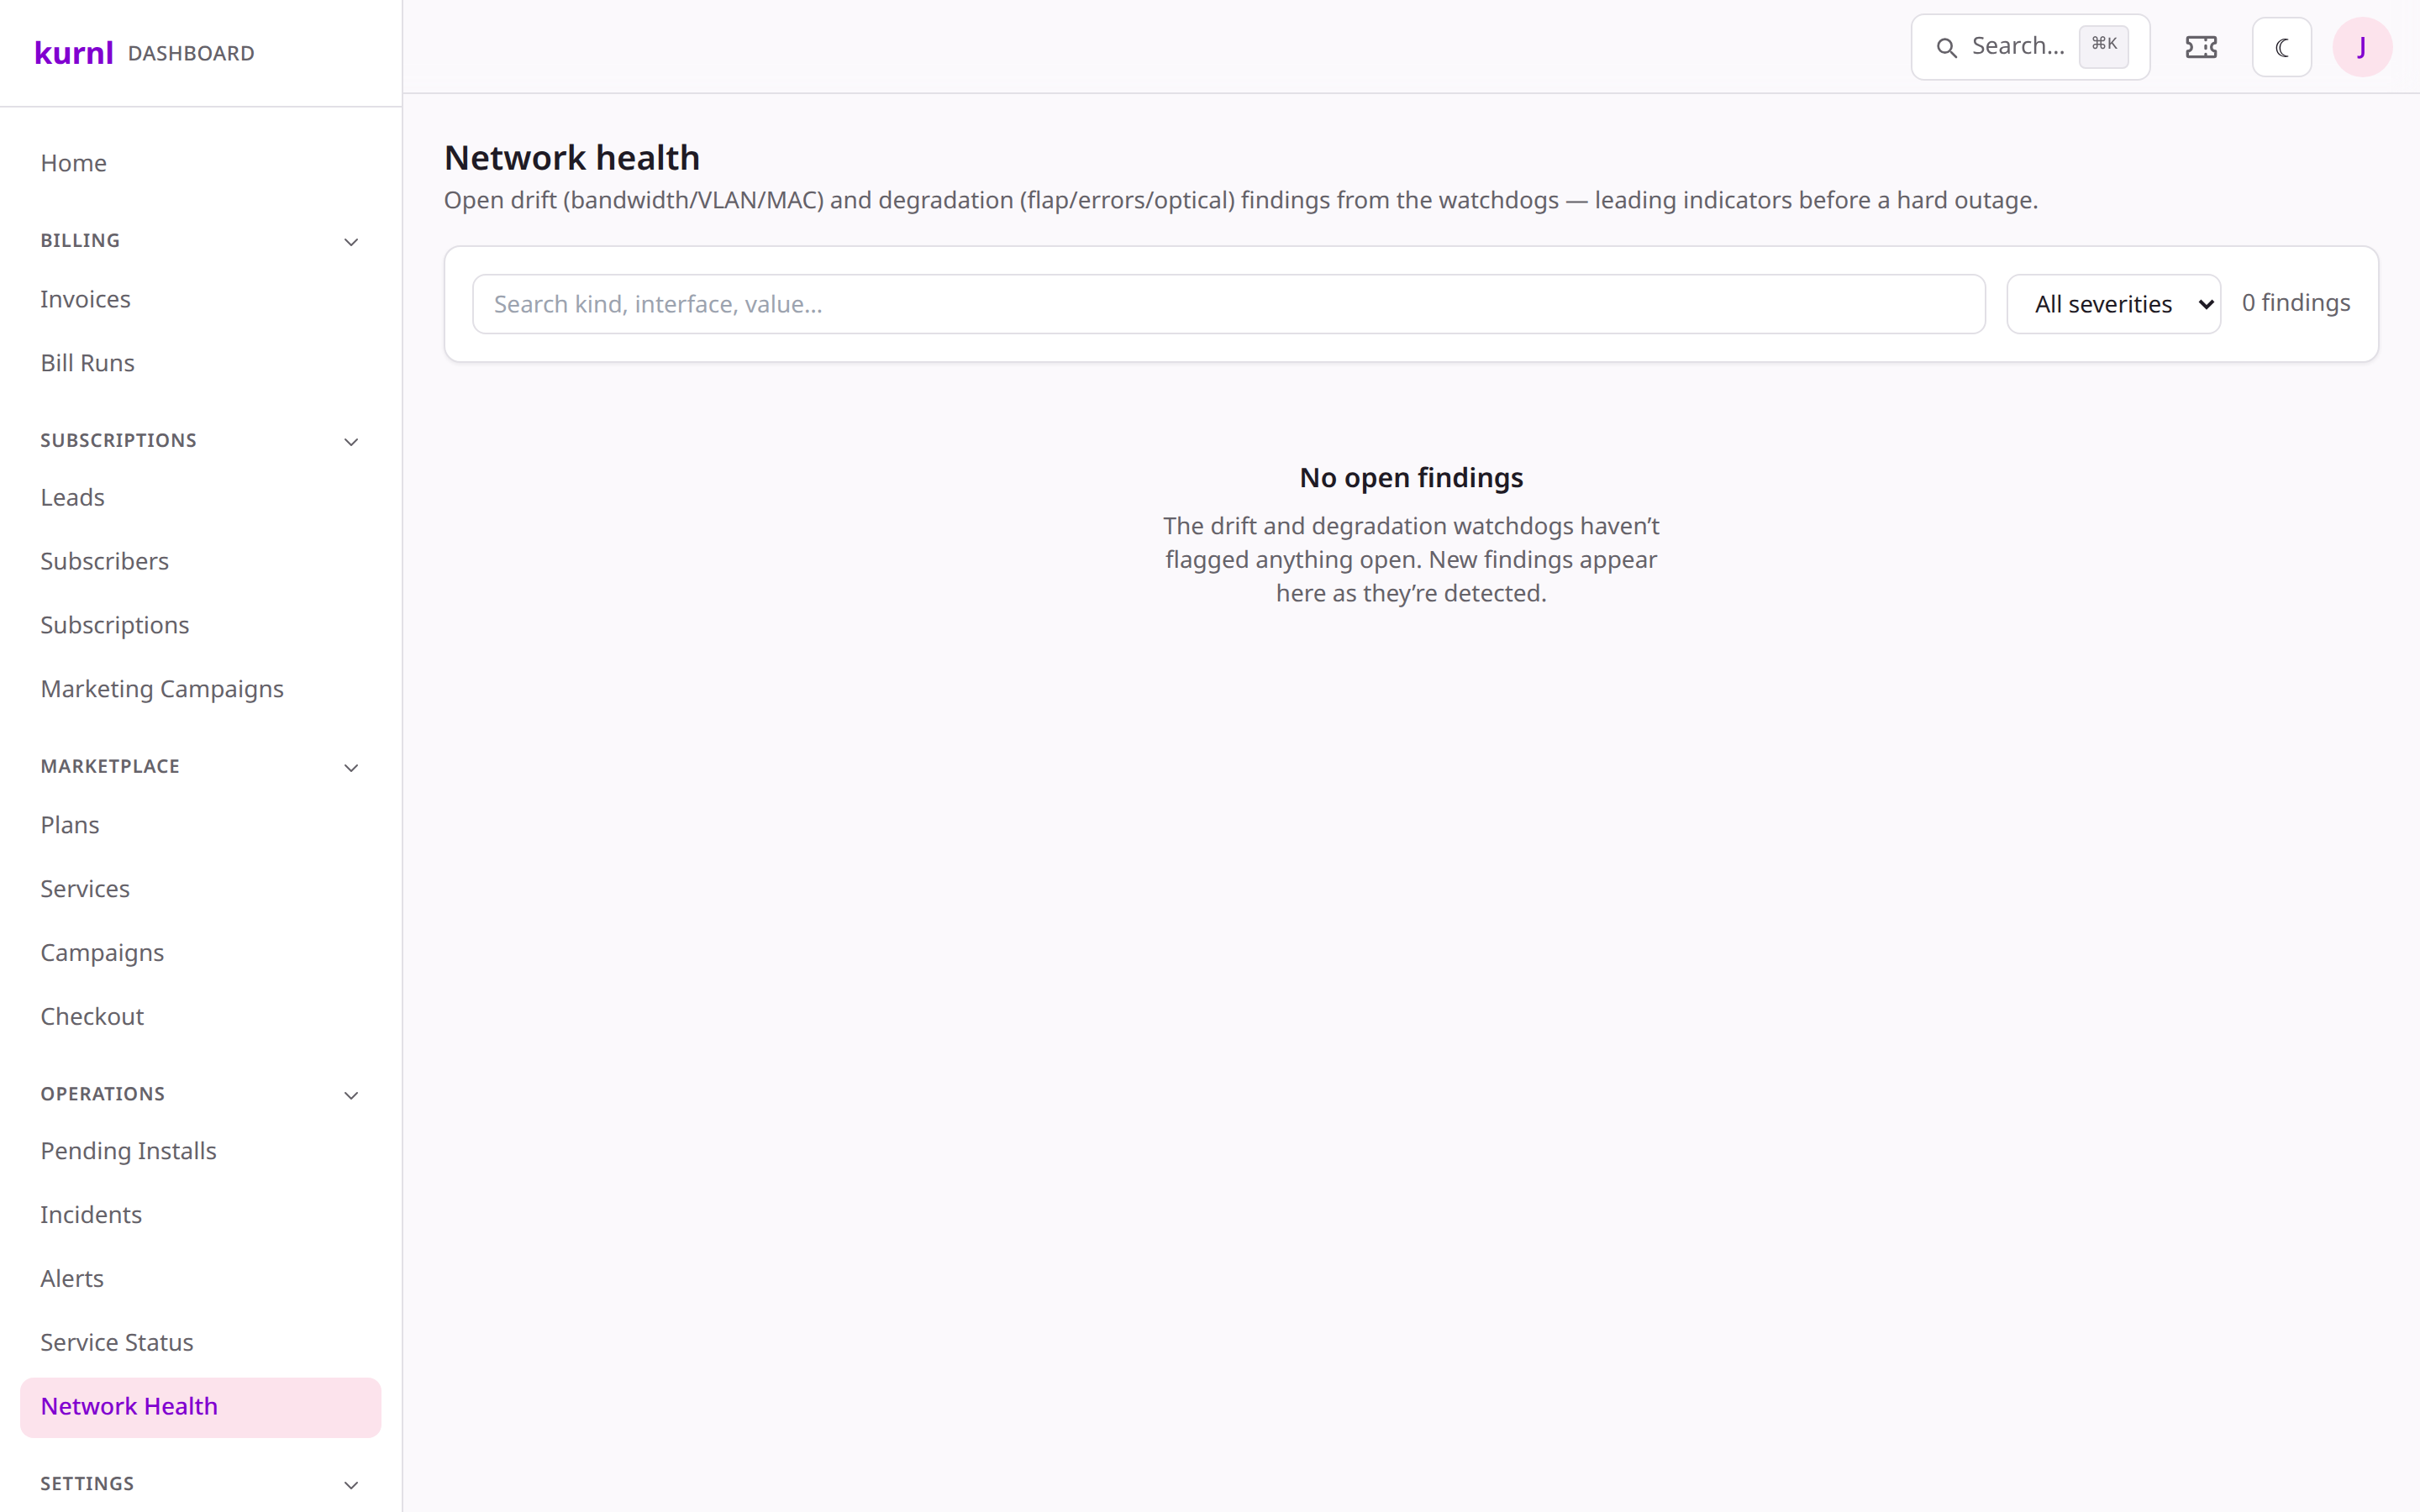
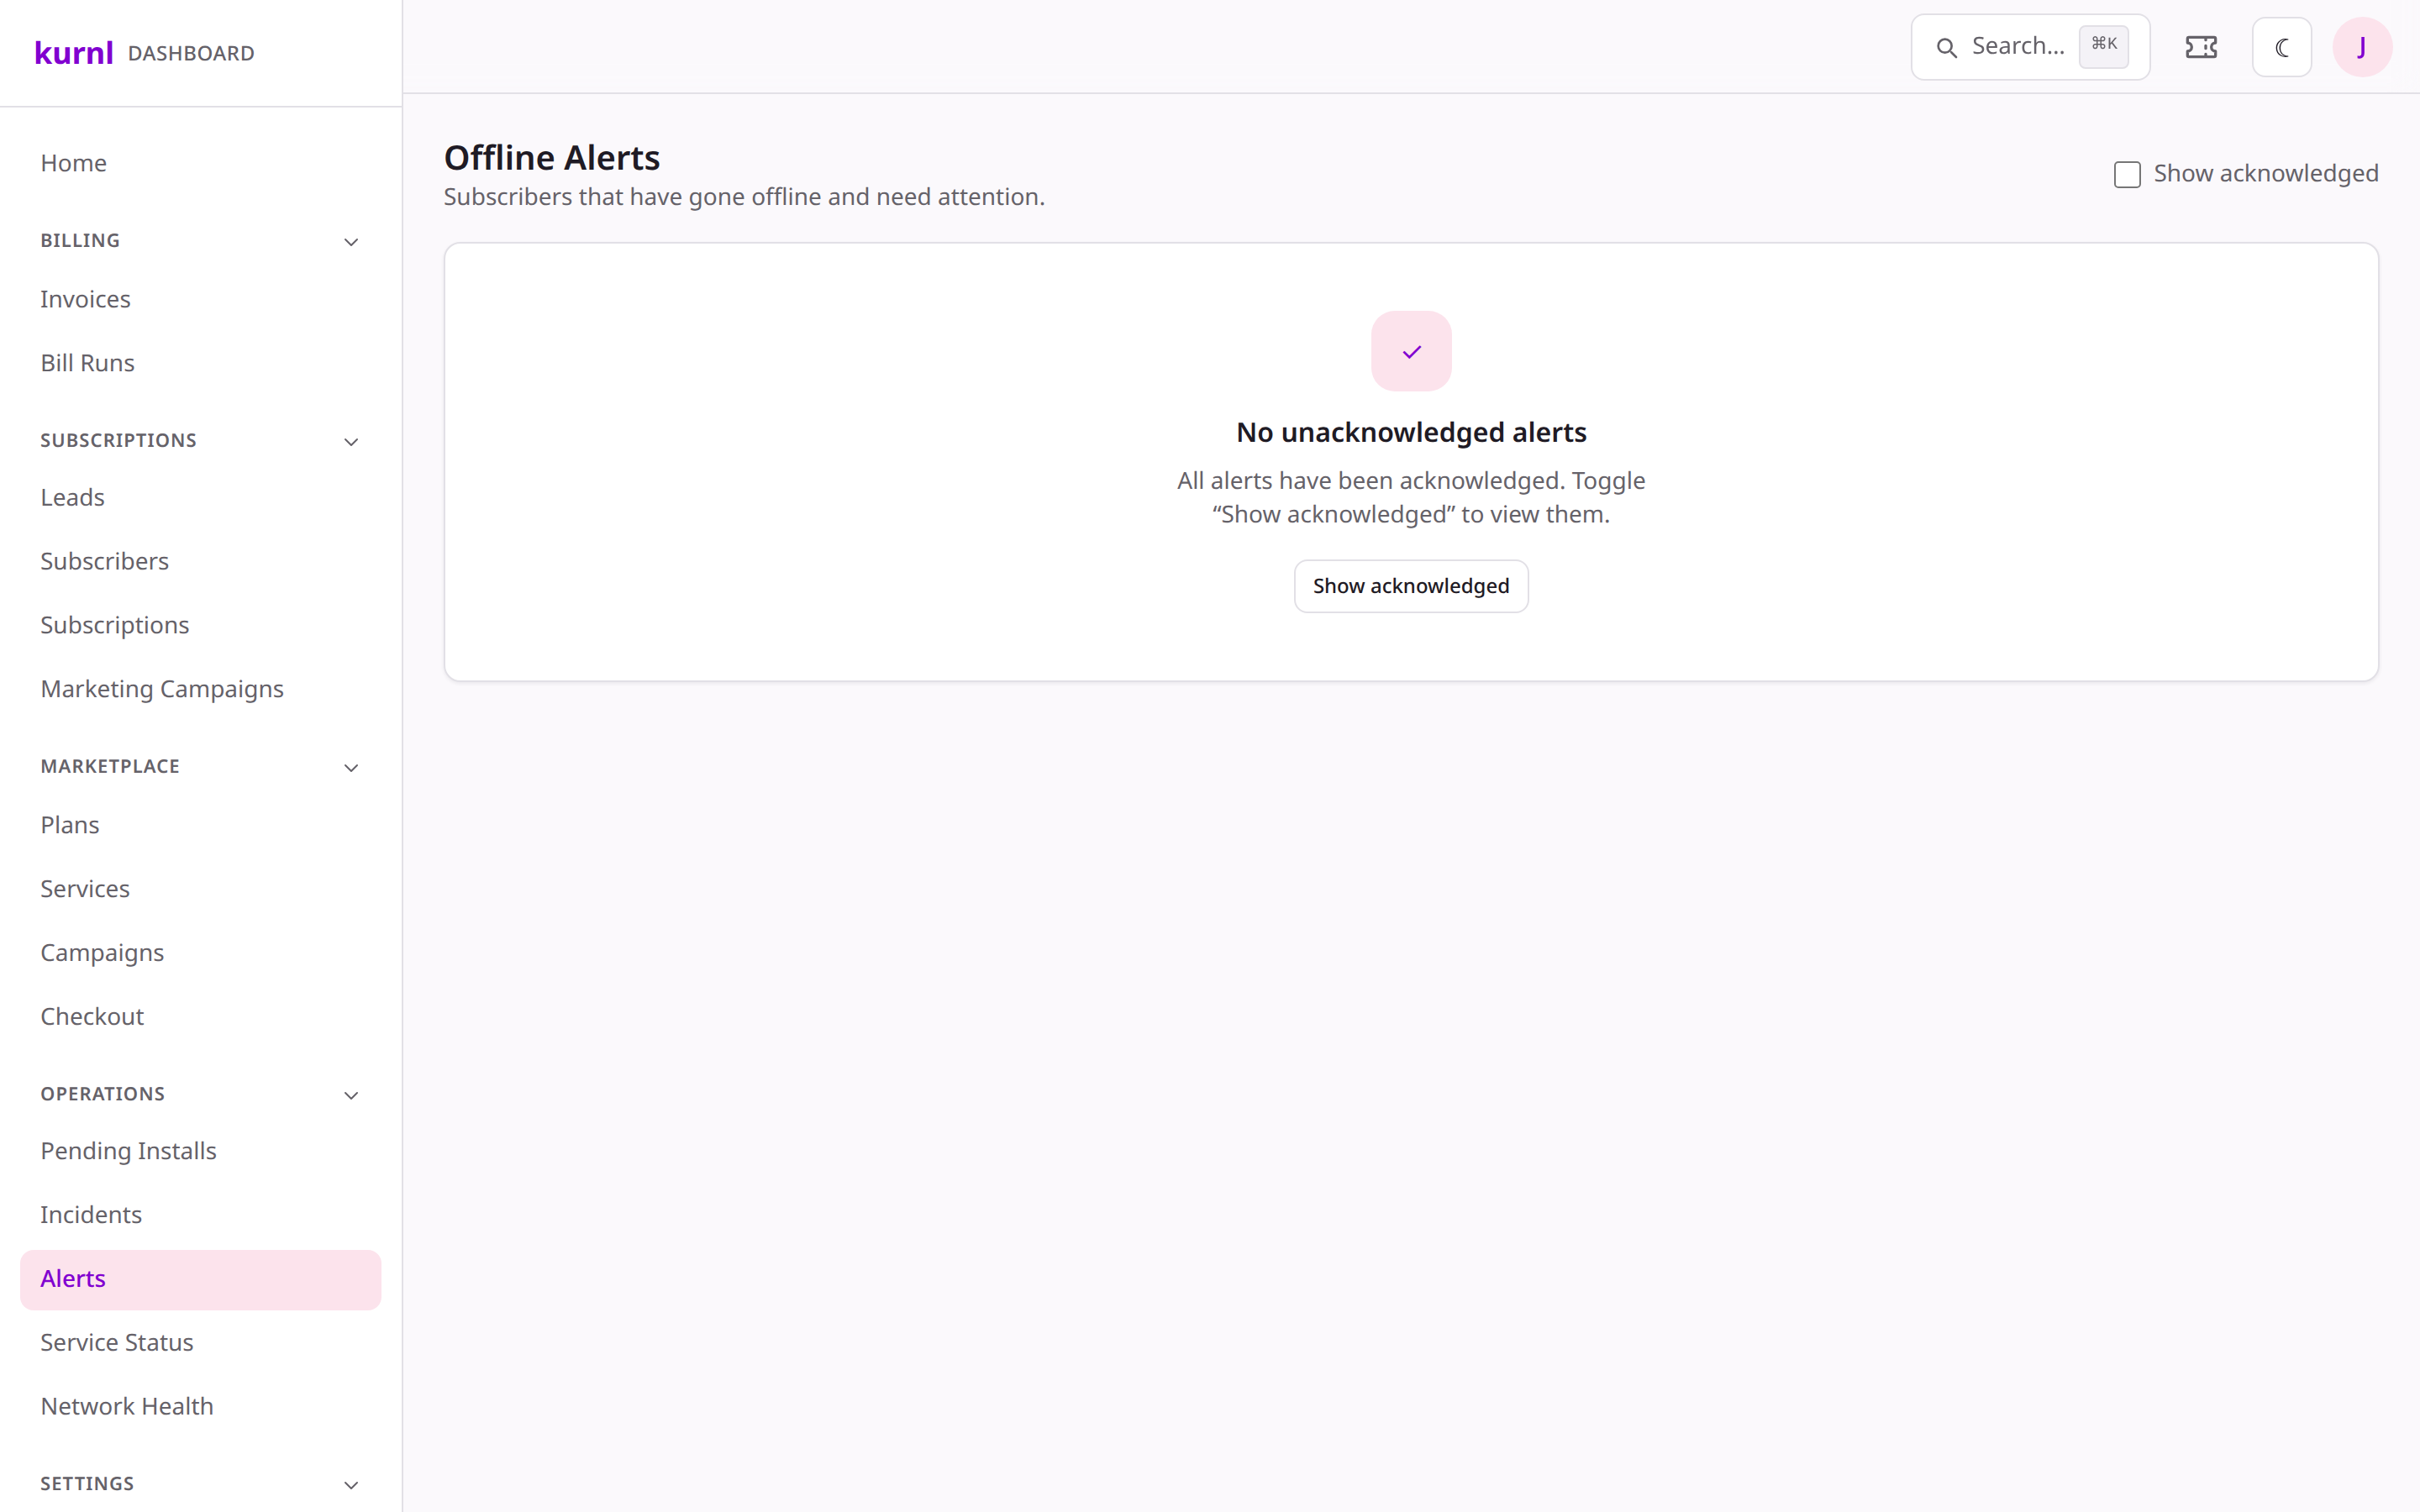
Watch the network from one place — per-port status and rate limits, drift & degradation findings, offline-subscriber alerts, and building-level incidents with branded subscriber comms.
The platform watches the network so you notice problems before subscribers
call. This guide covers the four NOC surfaces, from a single port up to a
building-wide incident.
Live status comes from per-port telemetry on the switches (SNMP → metrics).
Pages that read the switch degrade gracefully if a device is unreachable.
Per-port state for a switch — who’s connected, the configured rate limit, and
the expected-vs-seen check.
1
Open Network
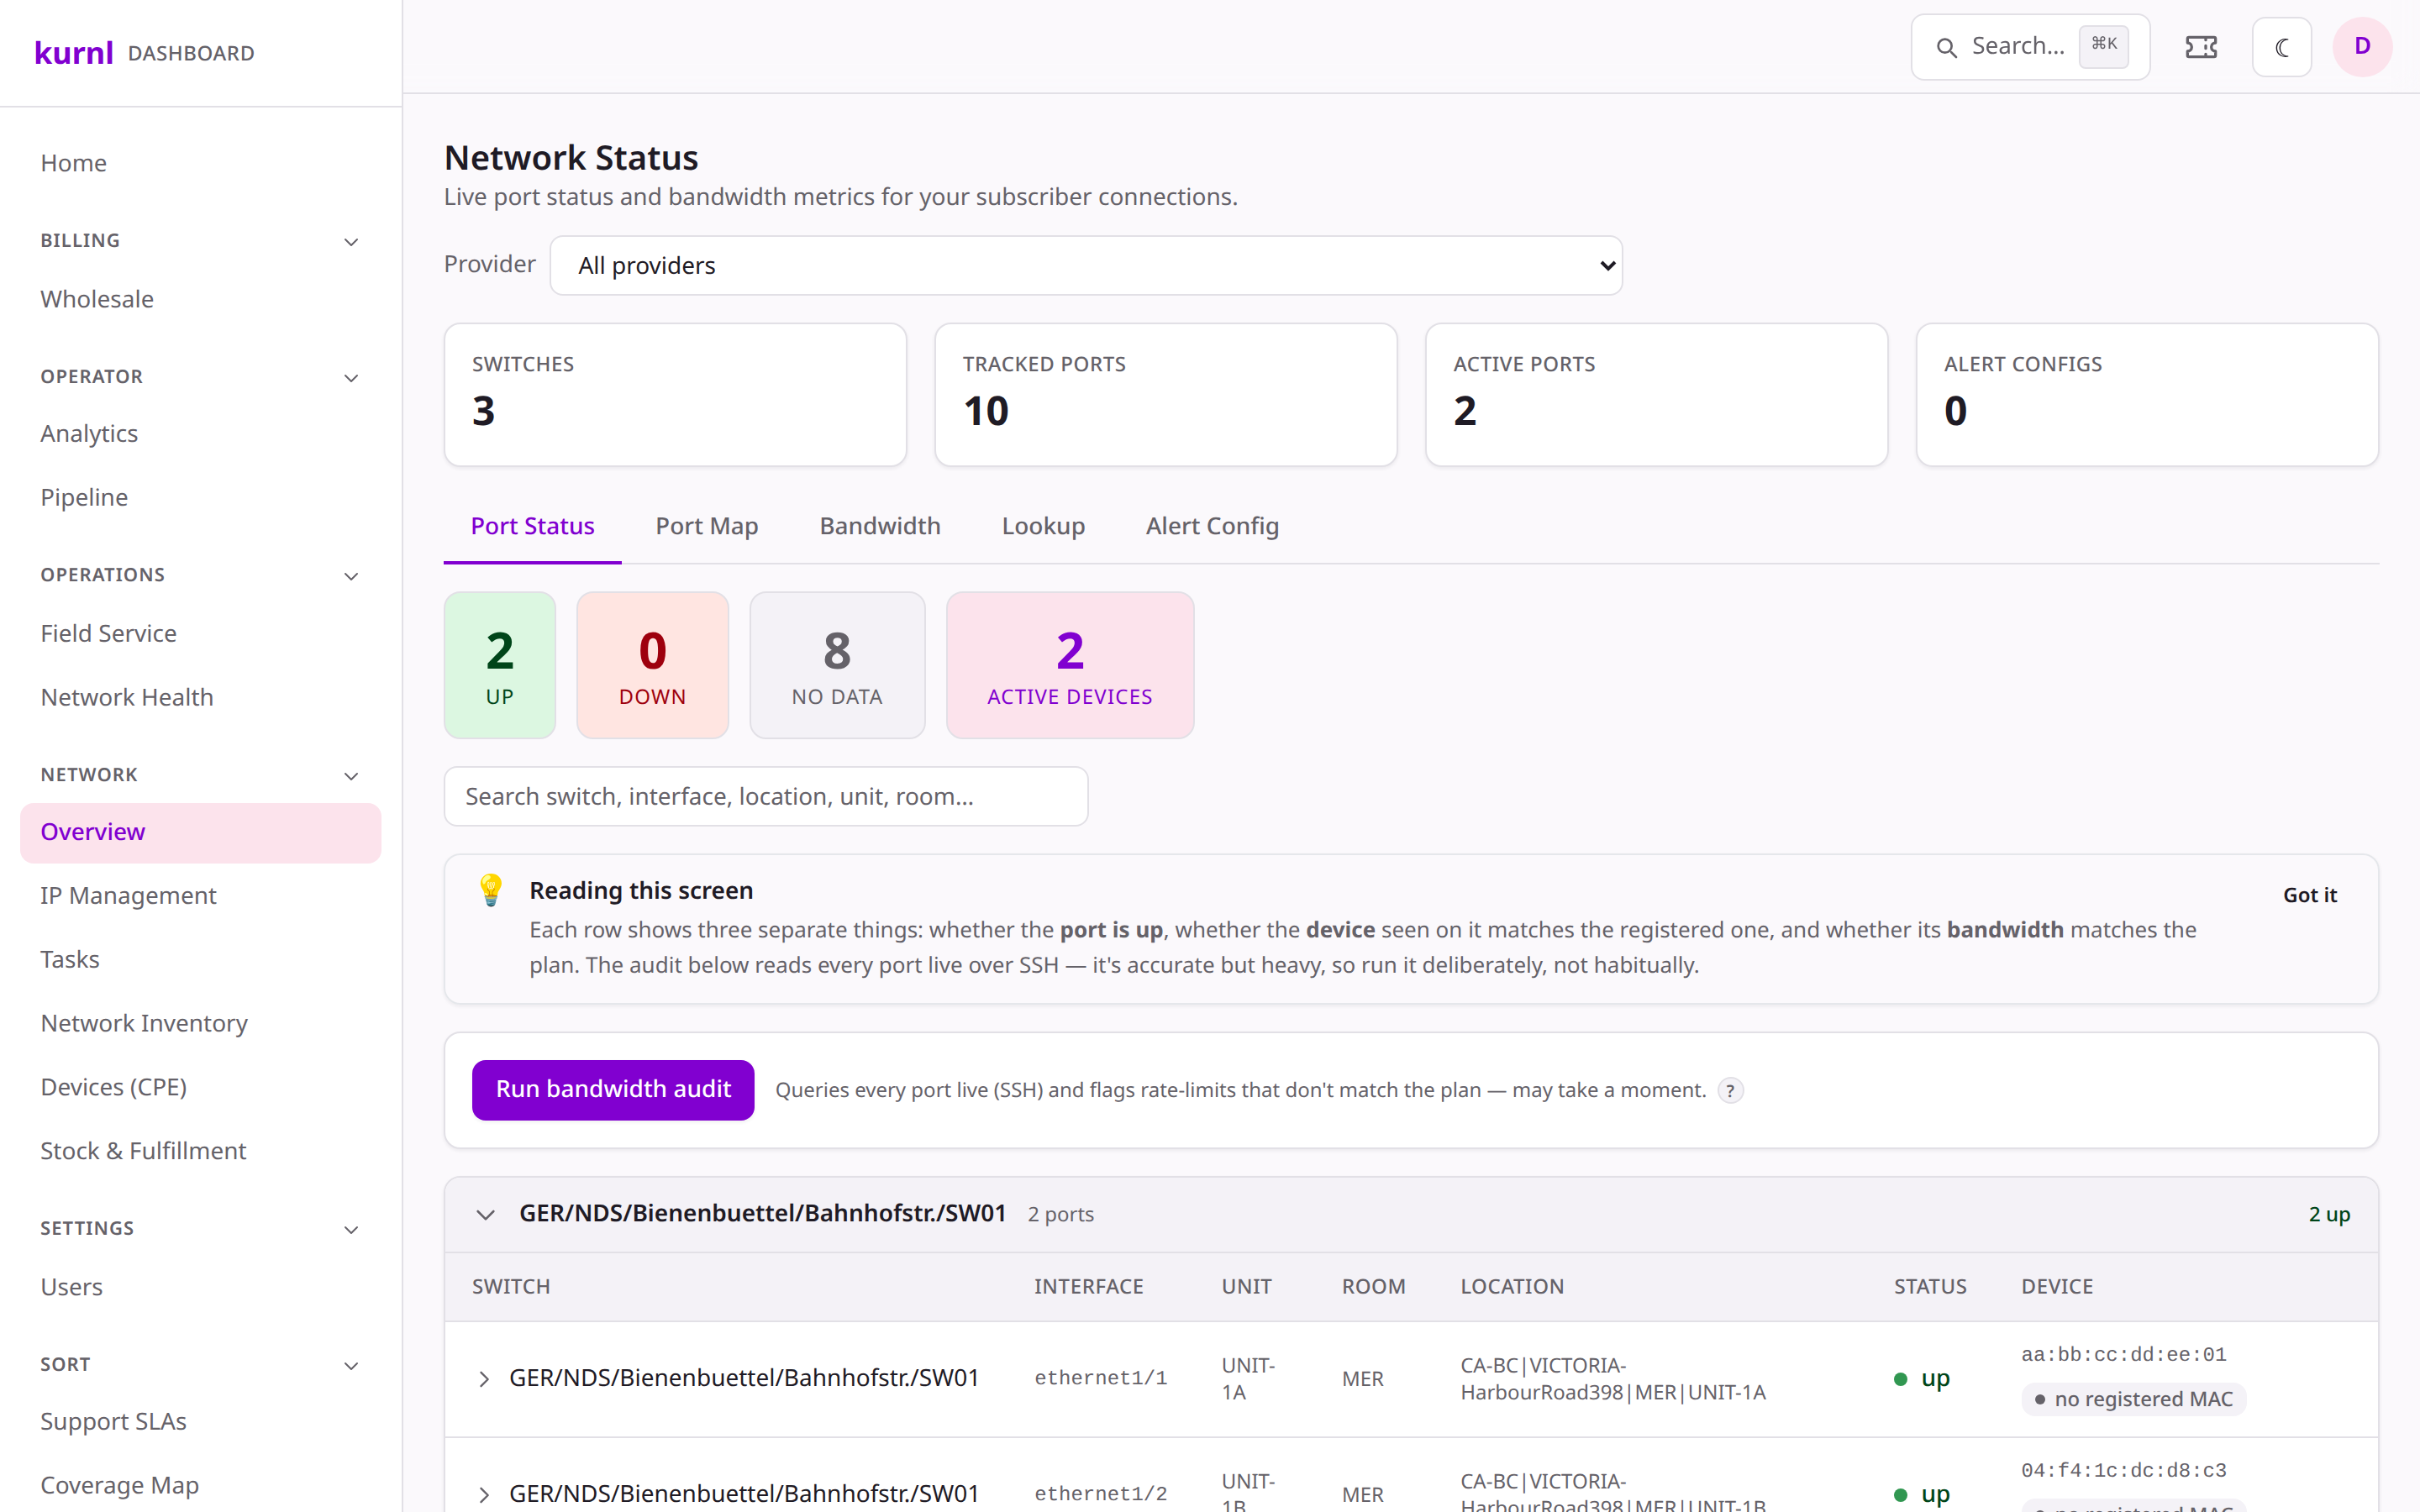
Go to Ports (under the Network section). Pick a switch to see each port: the connected device
(MAC / IP / vendor), whether it’s active, and the rate limit set for it.
Mismatches between the plan’s wholesale product and the port’s actual limit
are flagged so you can fix them.
Per-port network view
2
Per-port alerts
From here you can configure the email alerts that fire when a subscriber
port misbehaves.
Setting a port’s rate limit writes to the live switch — the dashboard gates it
behind an explicit confirm. Only do this on real hardware you intend to change.
The Port Map tab shows all physical ports on a switch — not just the ones
with a subscription — so you can spot problems the subscriber-derived views can’t.
1
Open the port map
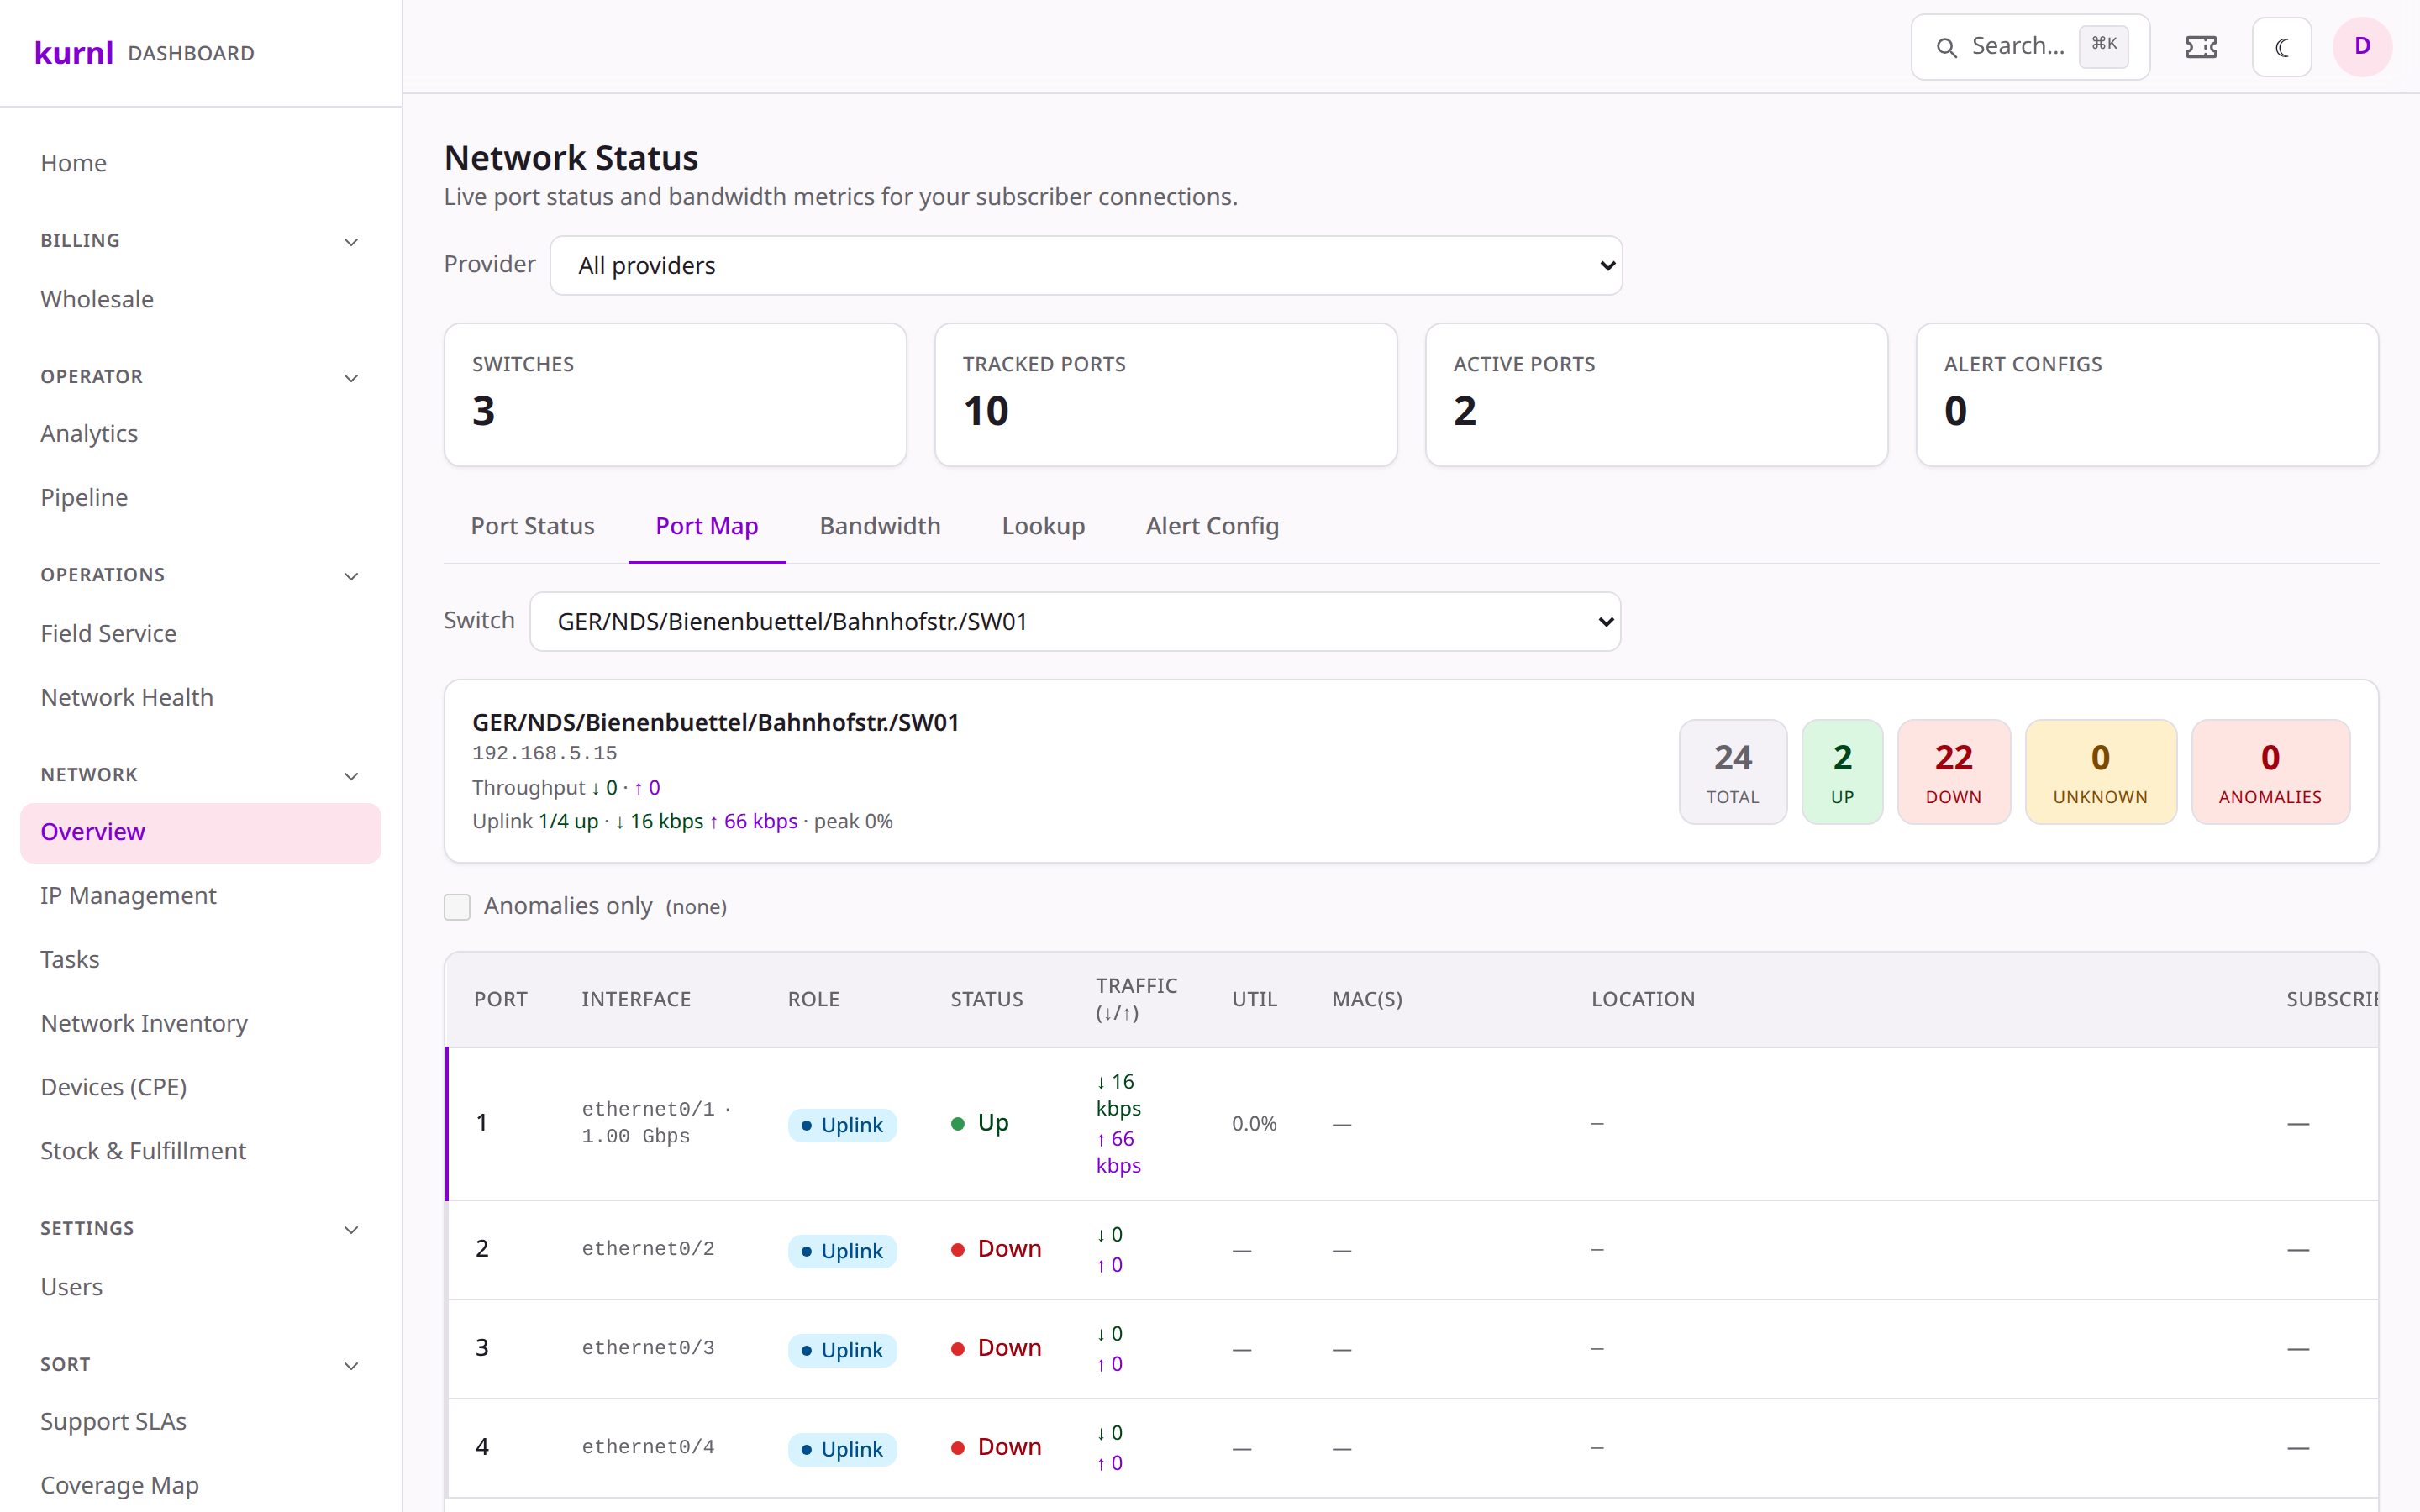
Go to Ports and open the Port Map tab, then pick a switch. Each port shows its live
up/down status, current traffic (in/out) and utilisation, the learned
MAC, and the location/subscriber it maps to.
Full port map with per-port traffic, utilisation and uplinks
2
Read the uplinks
Uplink ports (the switch’s backhaul) are listed first with an Uplink badge,
their link speed, throughput and utilisation. The summary shows how many
uplinks are up and the peak utilisation — an at-a-glance backhaul health check.
3
Act on anomalies
The header tallies anomalies; tick Anomalies only to focus. Flags include:
live, no location (a port is up but nothing is mapped to it), live, no
subscription, subscribed but down, a learned MAC that doesn’t match the
subscriber’s, and uplink saturated (a backhaul port at/over 80%).
Traffic and utilisation come from the switch’s SNMP counters. If a switch isn’t
being scraped yet, those columns are hidden (rather than showing a misleading 0)
and the port map still shows live up/down status.
A down or saturated uplink affects every subscriber on the switch —
those raise critical alerts on their own, separate from the per-port warnings.
When a whole building or segment drops, the platform opens one incident
(not one alert per subscriber) and can email affected subscribers on their
provider’s brand.
1
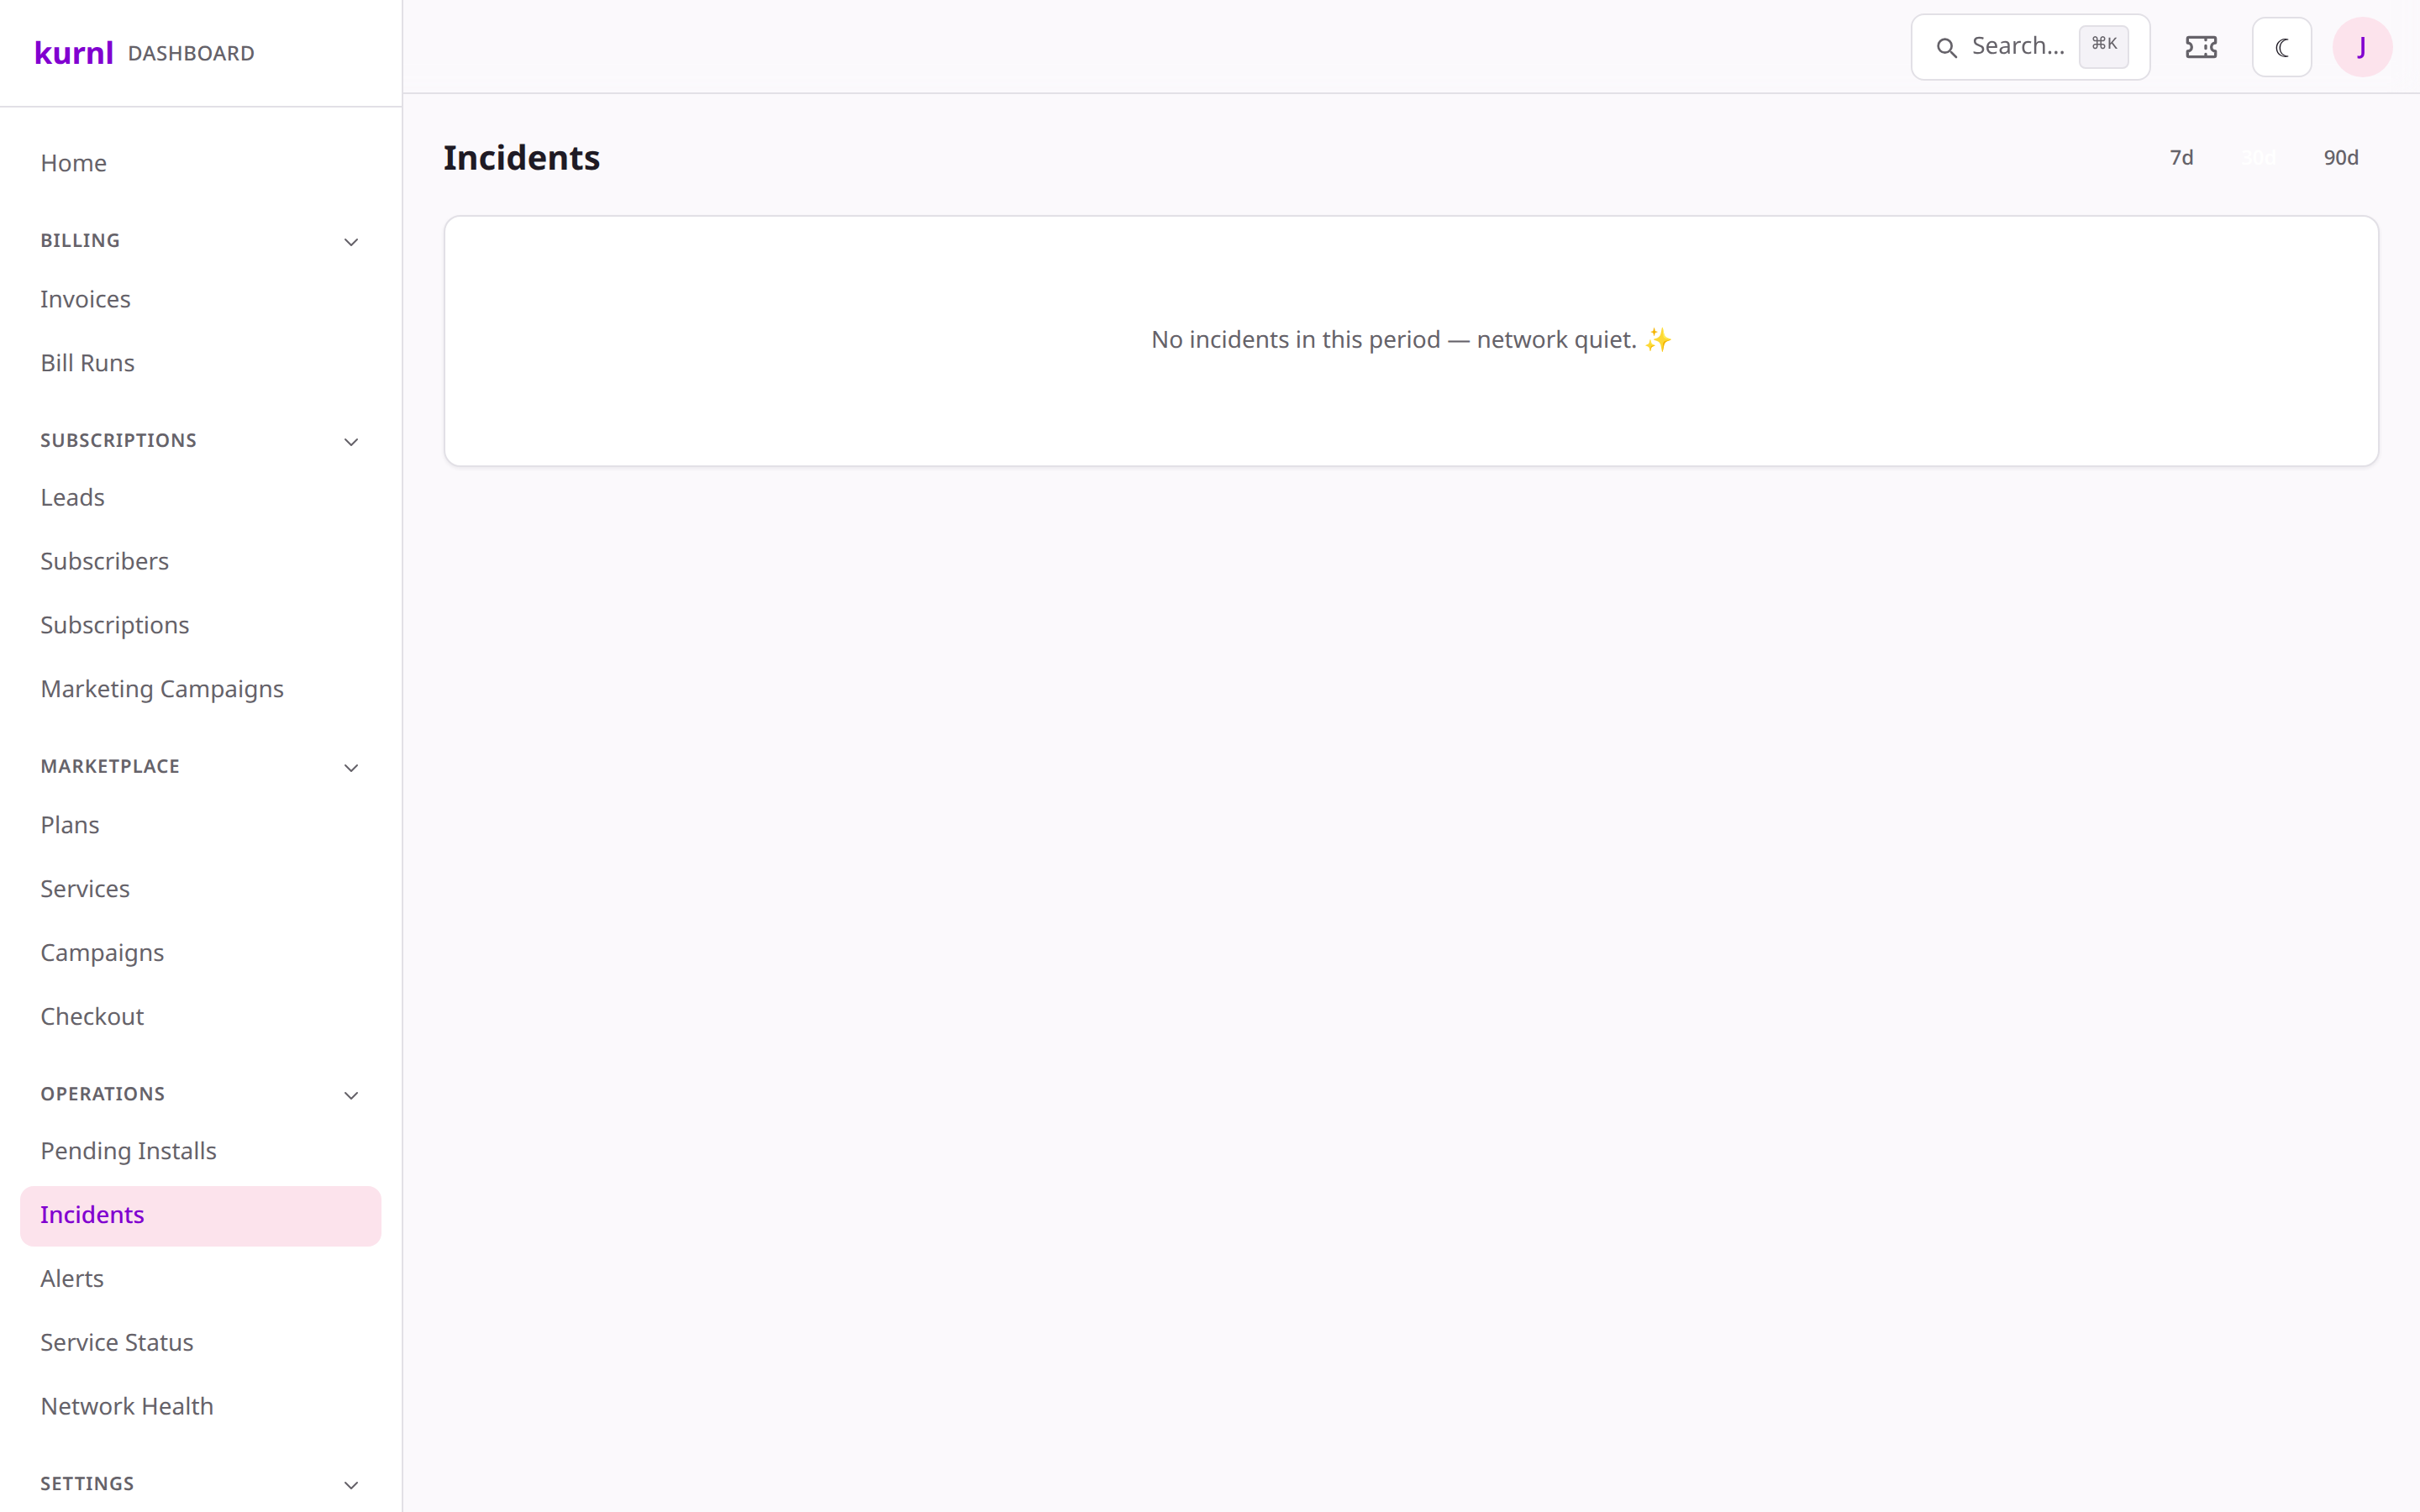
Open Incidents
Go to Incidents to see open and resolved incidents. Each shows what’s
affected and the comms sent.
Incidents
2
Branded outage & restore emails
Affected subscribers get a “we’ve detected an issue” email and a “back online”
email — on their provider’s brand, honouring notification preferences and
never emailing synthetic/test addresses.
Tune which comms go out per provider in
Branding & subscriber emails, and automate
follow-ups from a port.offline trigger in Automations.
The system “Service interruption email” waits 30 minutes and checks the line again before it sends —
a single port down is usually the customer’s own reboot or a pulled plug, and a port back in time means no
mail at all, no “restored” either. Outages of a whole switch or its uplink are told at once.