Explore and demo the dashboard on a safe copy of your data — no real subscribers, billing, or network — with event triggers and time-travel.
The dashboard sandbox lets you click through the entire operator dashboard on
an isolated copy of your catalog and sample data. It’s for learning the product,
demoing it, and rehearsing a change before you do it for real.
This is the in-dashboard safe mode for operators. It is not available to the
API: there is no sandbox API key, and every call made with your API key acts on
your live account — see API sandbox.
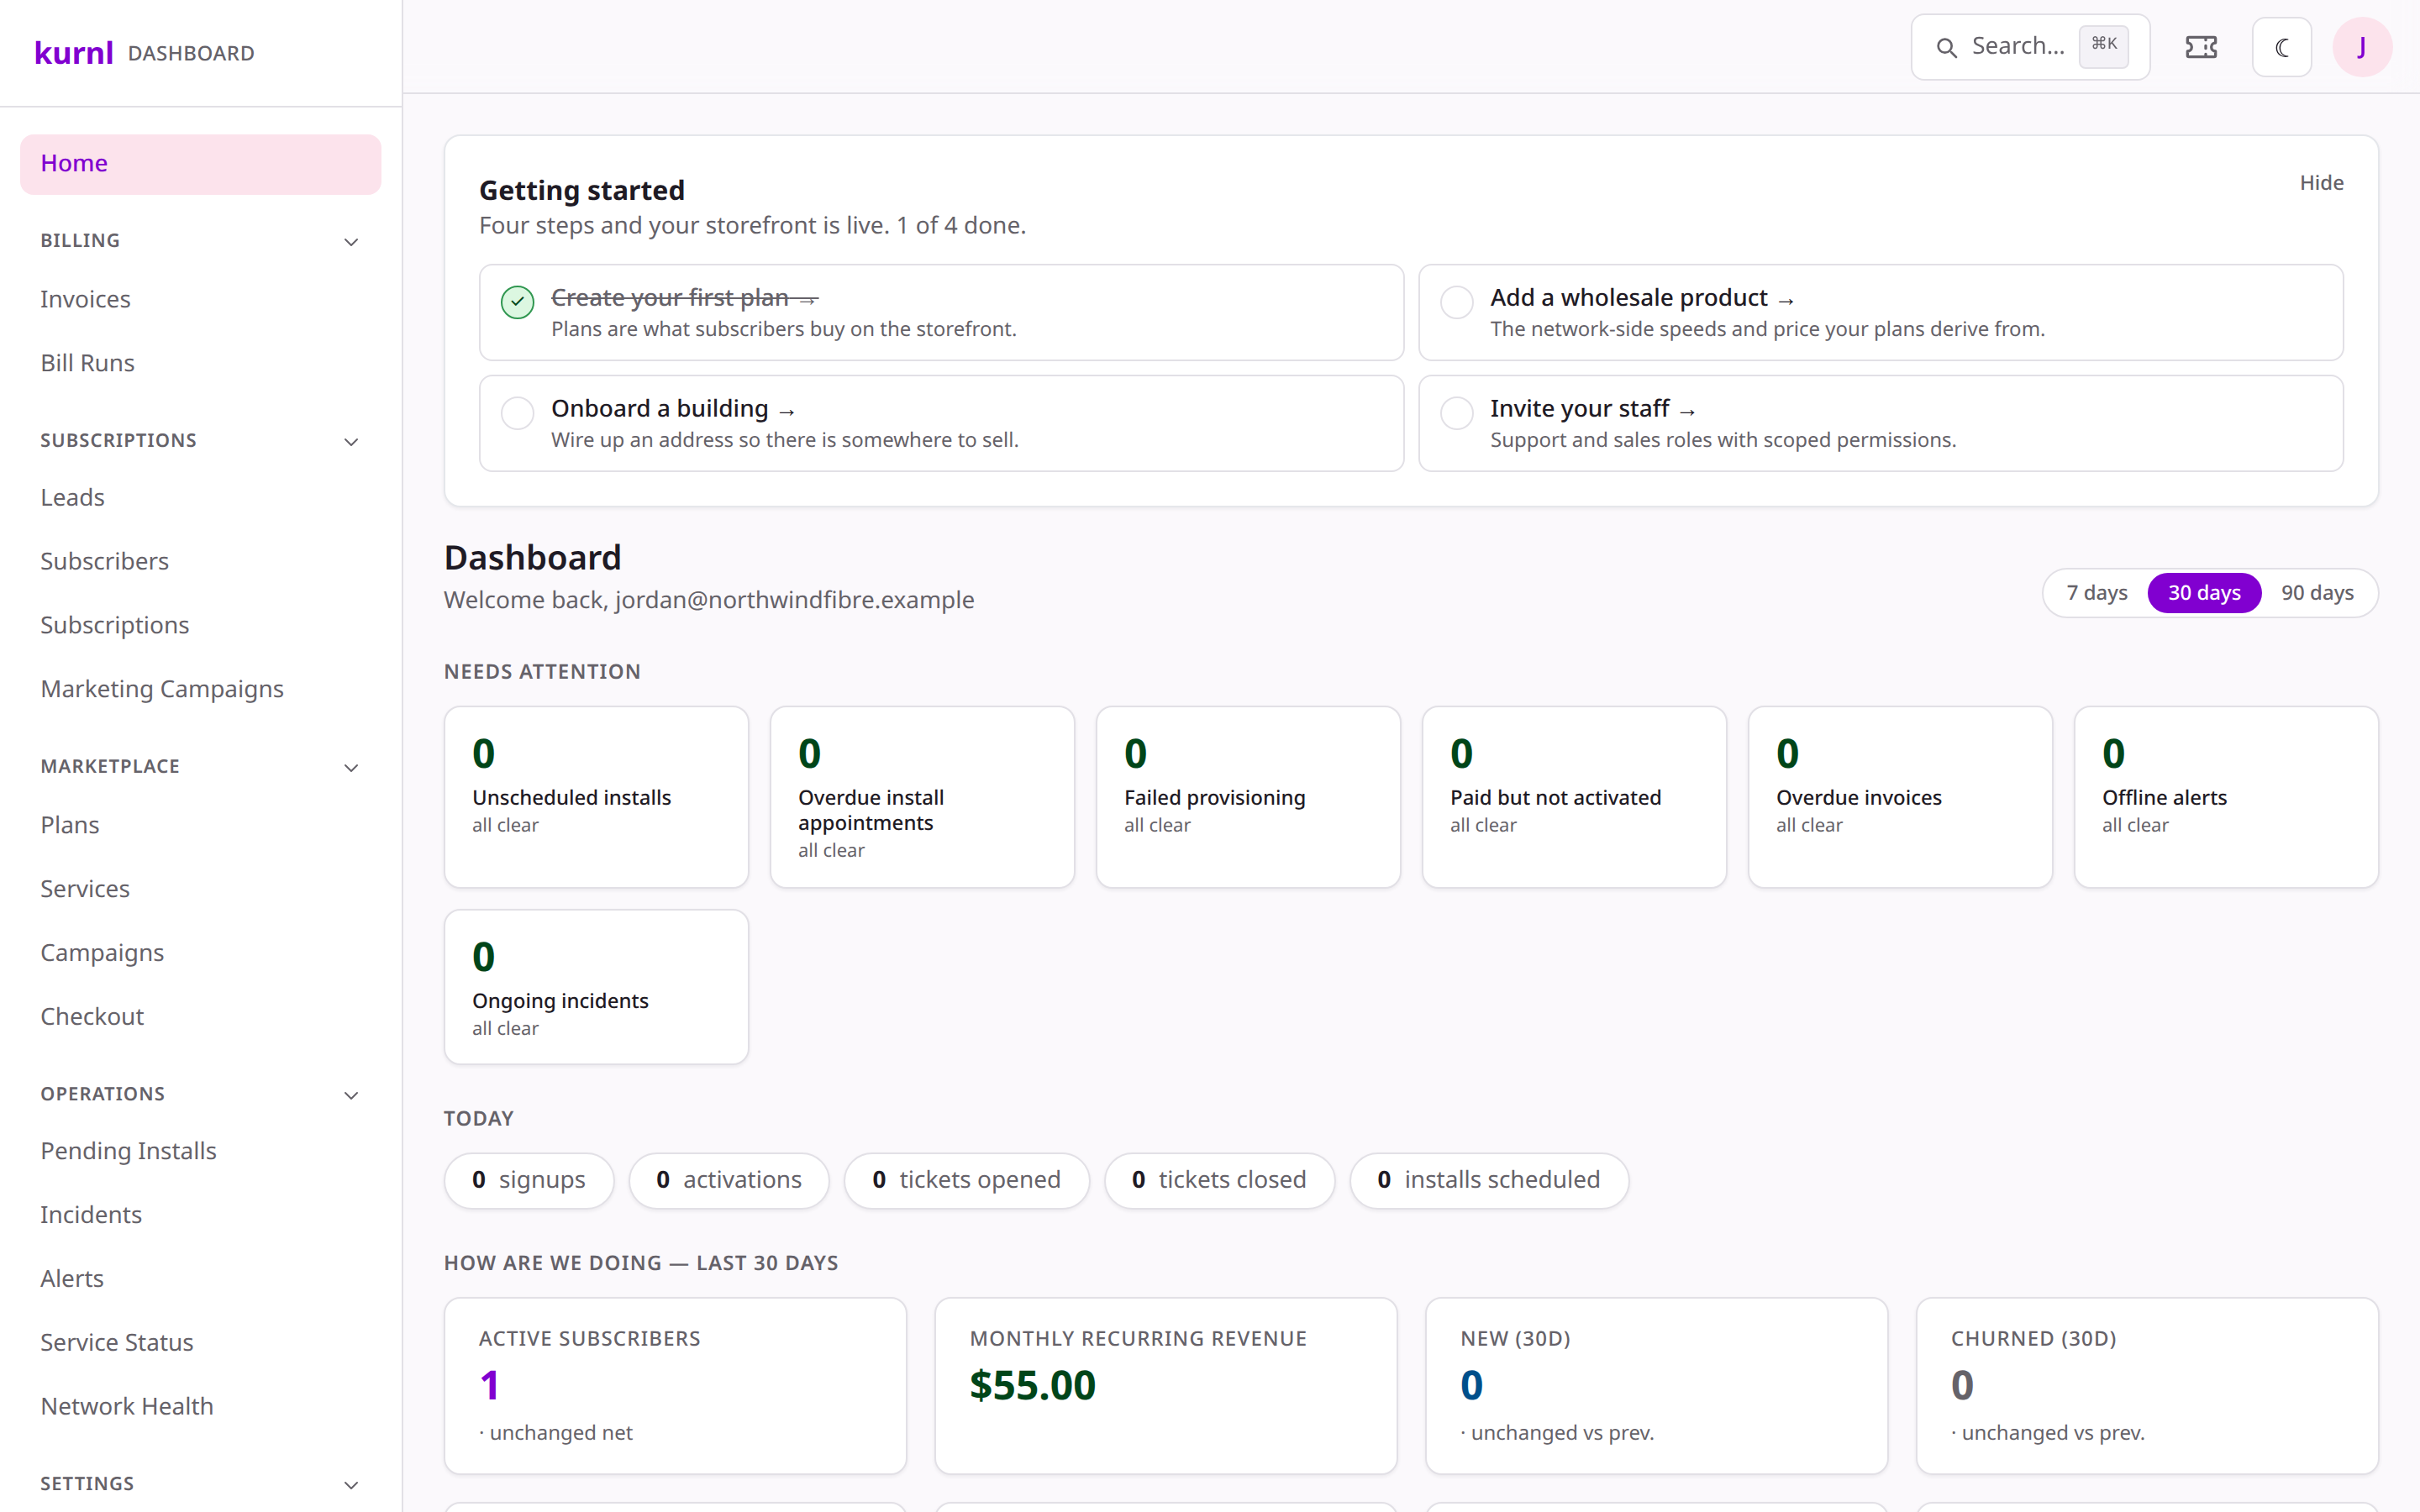
Click Enter sandbox at the bottom of the sidebar. The dashboard swaps to
the sandbox context and shows a persistent banner so you always know you’re in
it.
Enter sandbox from the sidebar
2
Explore
Every page works as normal — subscribers, plans, billing, network — but on
sample data. Nothing you do here reaches production.
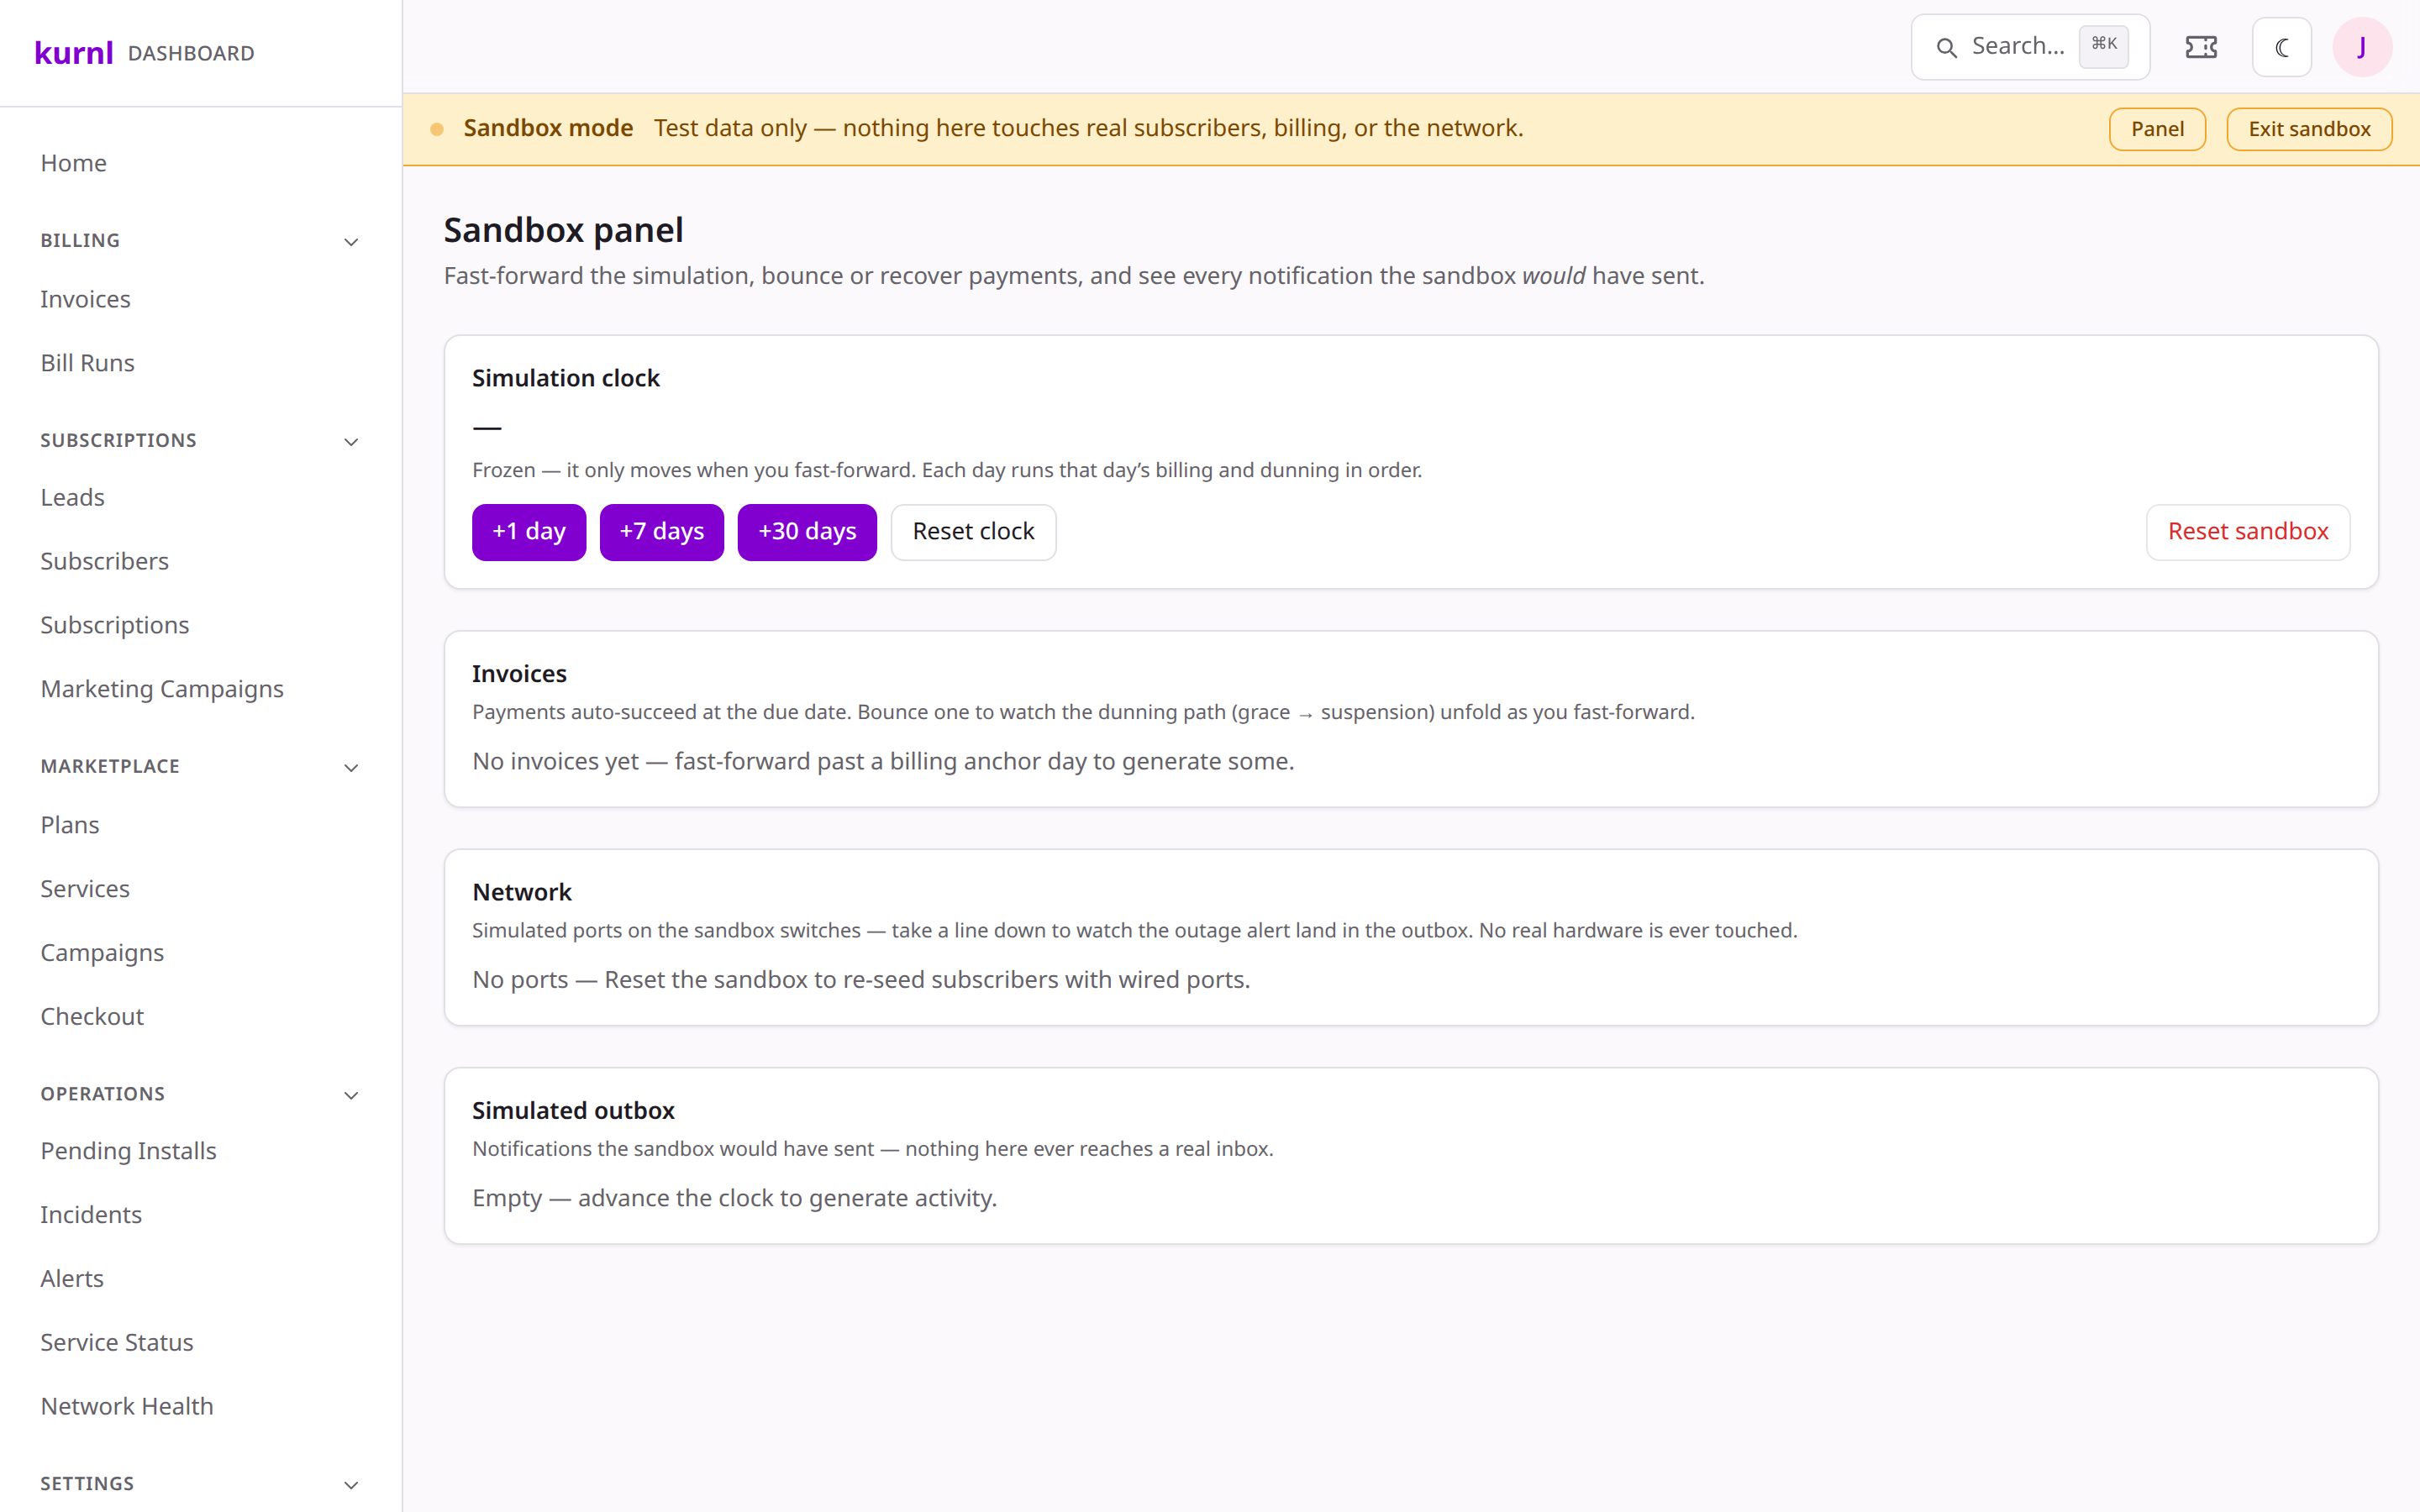
The sandbox panel
3
Fire event triggers
From the sandbox panel, trigger scenarios — a failed payment, a recovery, a
line going down — to see how the dashboard and comms respond, safely.
4
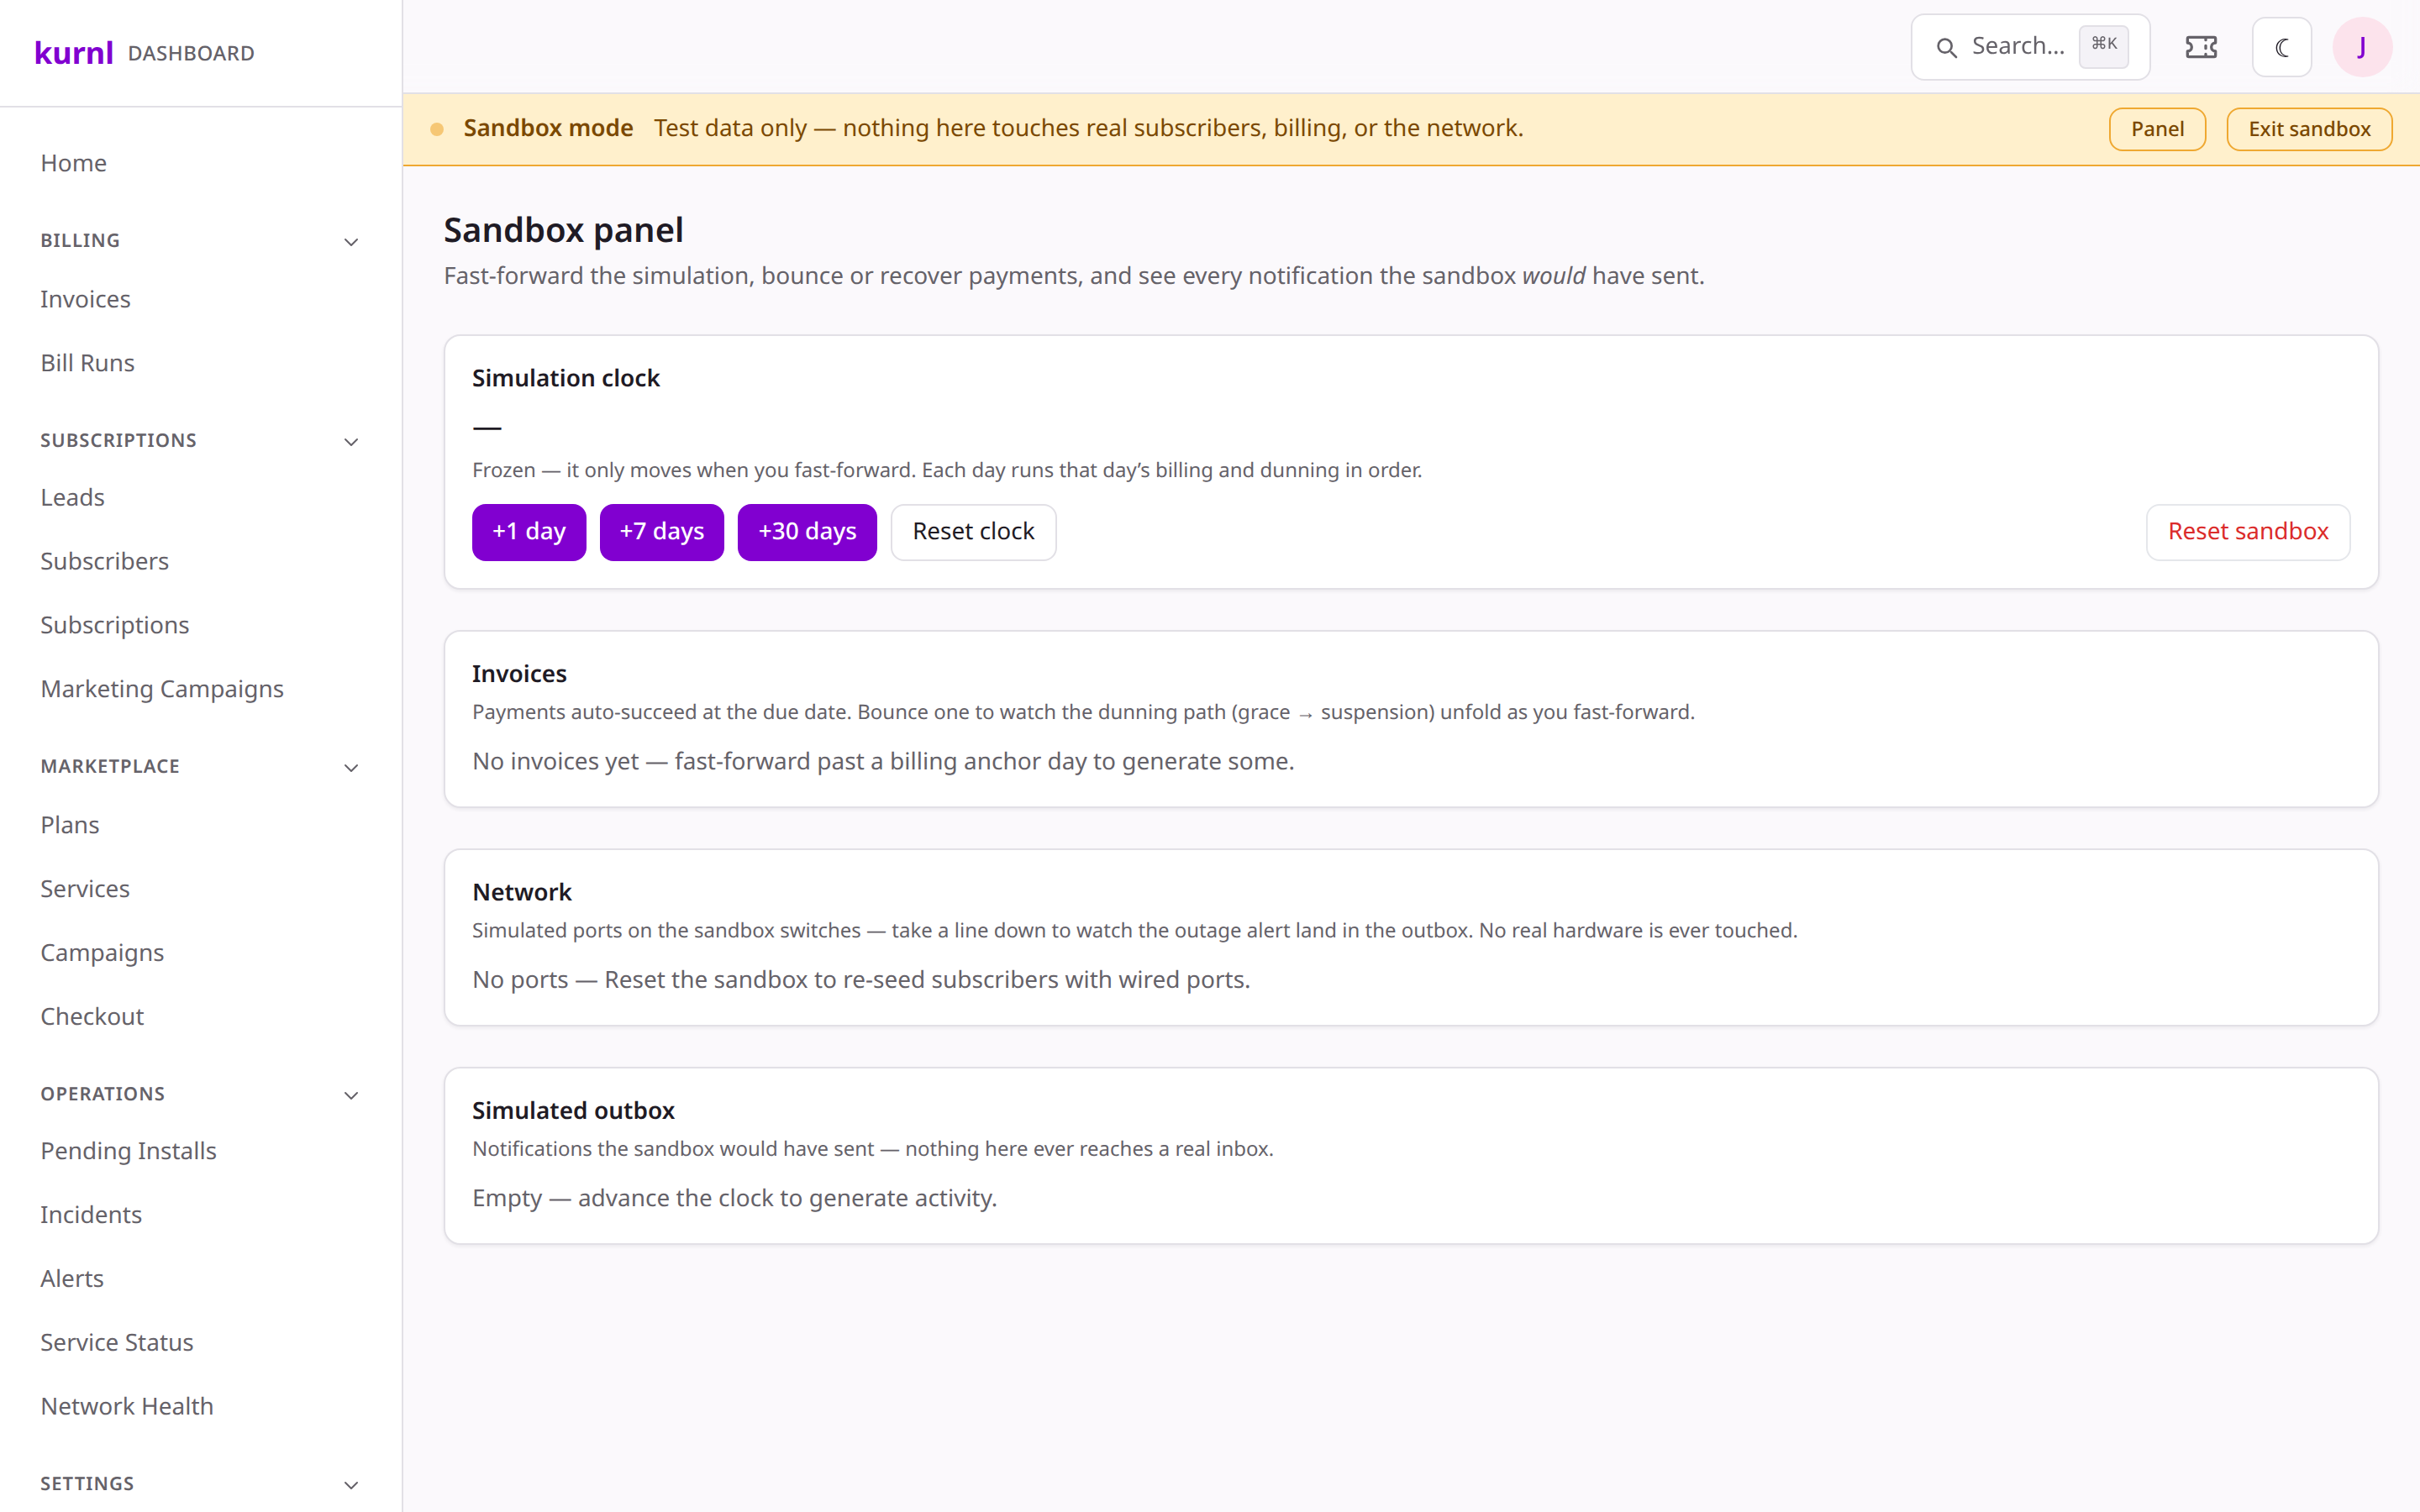
Time-travel
Advance the sandbox’s clock to see what happens across a calendar month or a
dunning window without waiting real days.
Time-travel and triggers
5
Reset or leave
Two reset controls do different things: Reset clock puts the sandbox’s
time back to real time, while Reset sandbox (behind a confirm dialog)
wipes the sandbox and re-seeds it to a clean sample state. Exit sandbox,
in the banner at the top, takes you back to your real dashboard — your
production data was never touched.